Prior predictive check for the Bayesian hierarchical SDT model
Source:R/priors.R
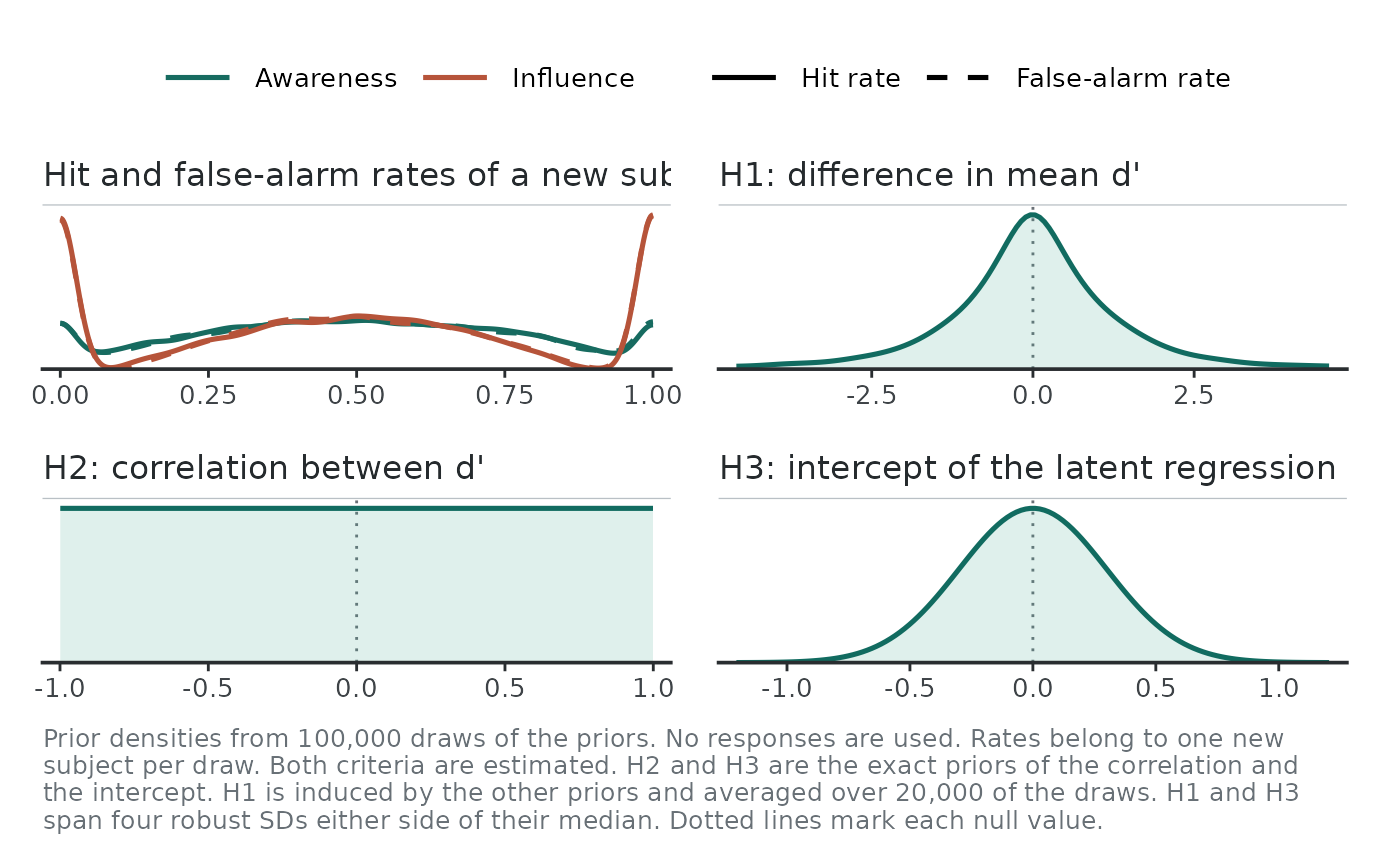
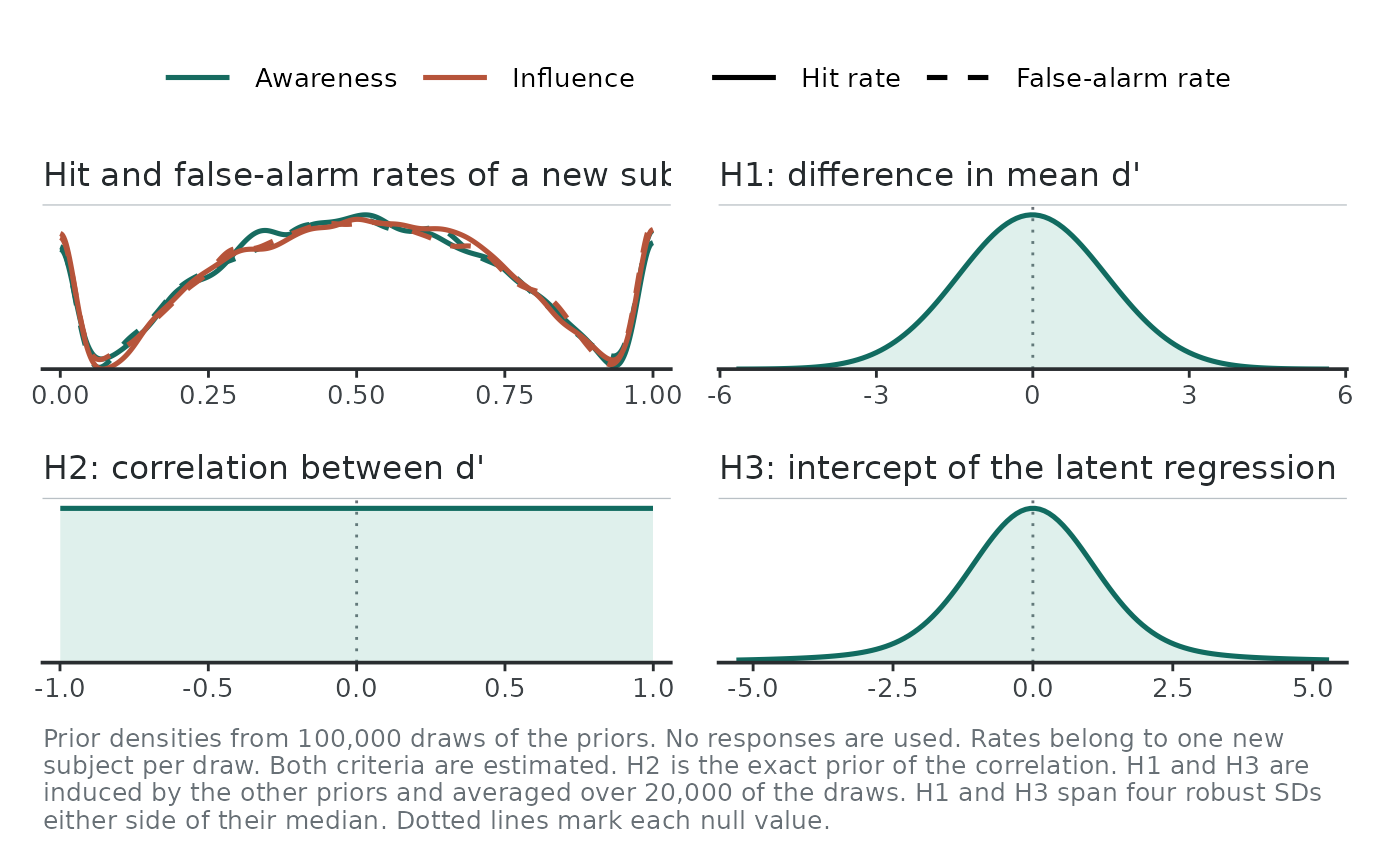
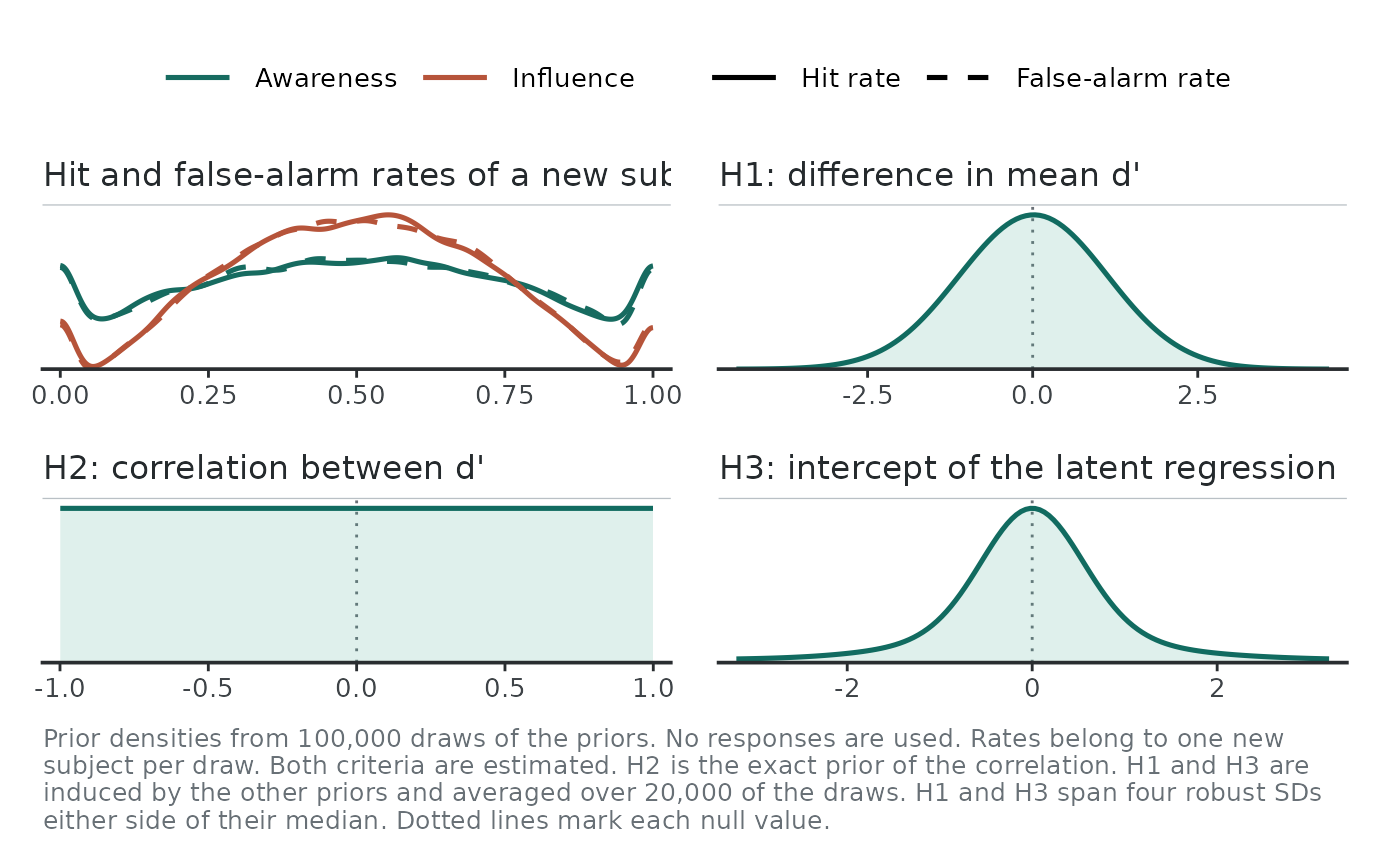
plot.usdt_priors.RdDraws what the priors imply before seeing any data: the hit and false-alarm rates of a new subject in each task, and the prior of the quantity tested by each hypothesis. Use it to check that the priors allow the data you expect and to see the prior that the model induces on the latent intercept.
Arguments
- x
A
usdt_priorsobject fromusdt_priors().- data
Optional
usdt_dataobject. When given, a criterion fixed by the median split stays fixed, as inhsdt(), and the tasks take the data labels. Without it, both criteria are estimated. The caption says which criteria are fixed.- unequal_variances
Logical. Simulate the signal standard deviation from its prior instead of fixing it to 1.
- latent
How the model writes the relation between the two latent sensitivities, as in
hsdt(): by their means, standard deviations and correlation ("correlation", the default) or by the latent regression of the influence on the awareness one ("regression").- caption
Logical. Show the caption that explains the plot under it (default
TRUE).- ...
Ignored.
Details
The plot simulates 100,000 draws from the priors in R. No model is fitted and Stan is not needed.
The rates panel shows the hit and false-alarm rates of one new subject drawn from each population draw. Rates piled up at 0 or 1 mean that the priors allow extreme performance.
Each hypothesis panel shows the prior of the quantity it tests. A quantity
with a prior of its own is drawn exactly: the correlation (H2), and under
the latent regression also the intercept (H3). The others have priors that
the model induces through the remaining priors: the intercept under the
correlation parameterization, the difference (H1) under the latent
regression. Each of these is drawn as the density that one prior gives it,
averaged over 20,000 prior draws of the other parameters (a Rao-Blackwell
estimate), the same priors that usdt_bf() averages over 100,000 draws.
The difference (H1) and the intercept (H3) span four robust standard
deviations either side of their median, since an induced prior of either
has heavy tails. Dotted lines mark the value of each hypothesis under the
null.
Examples
plot(usdt_priors())
 # A narrower prior for the mean influence sensitivity
plot(usdt_priors(dprime = list(awareness = "normal(0, 1)",
influence = "normal(0, 0.5)")))
 # The latent regression, with a prior on its intercept
plot(usdt_priors(intercept = "normal(0, 0.3)"), latent = "regression")